Digital Marketing
Diwali Campaign Metrics Small Businesses Must Track
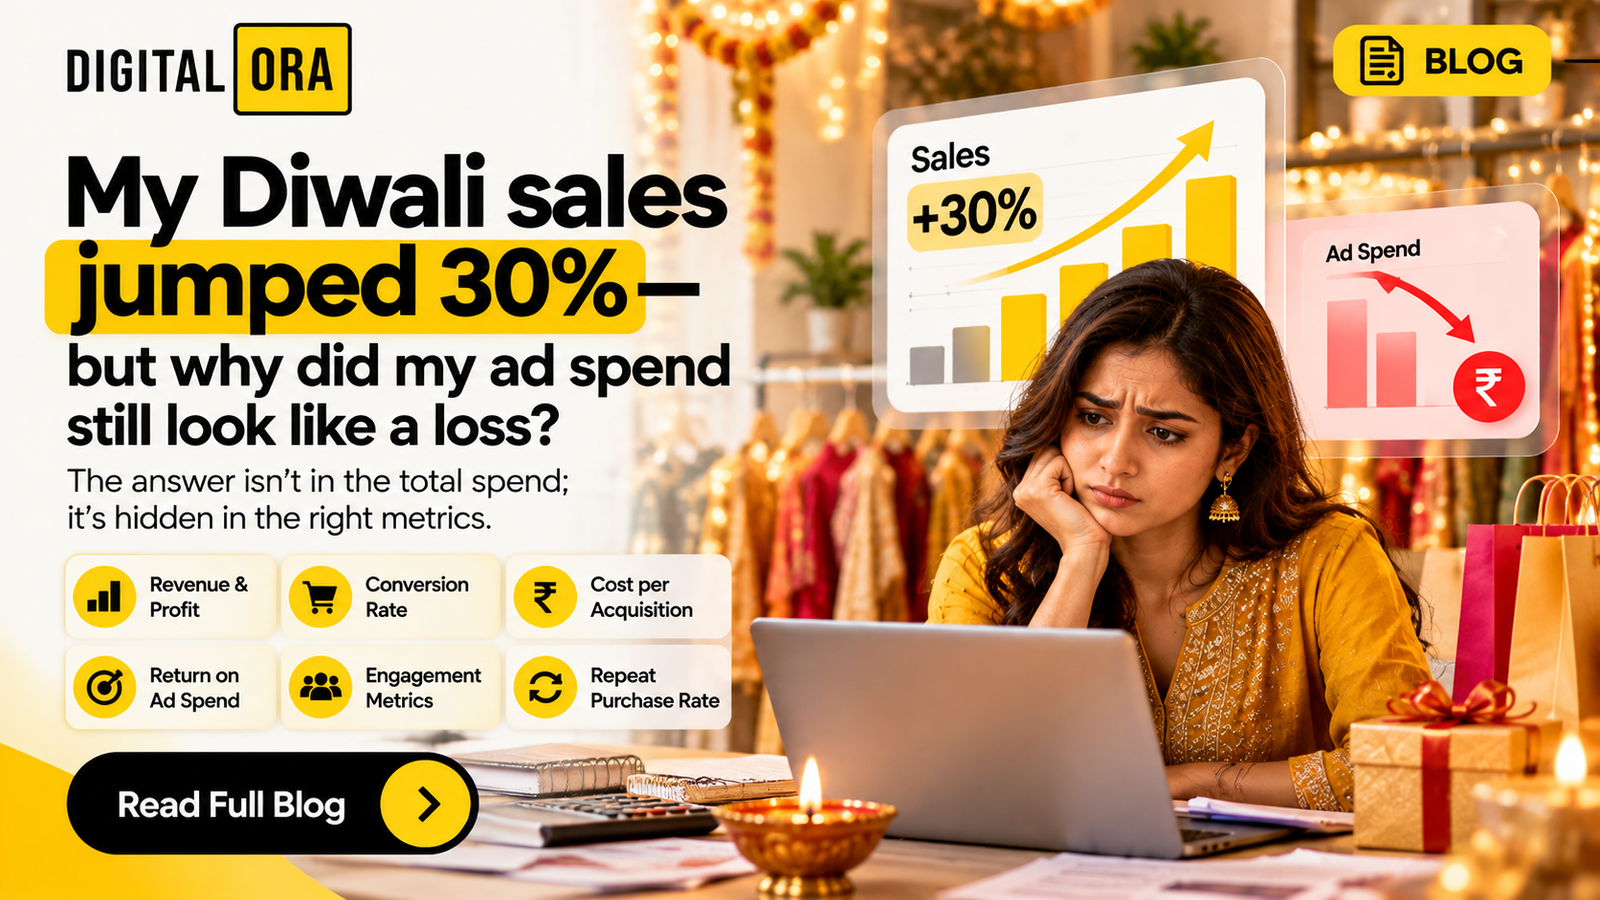
"My Diwali sales jumped 30%—but why did my ad spend still look like a loss?" That’s the question I hear every year from a Bandra boutique owner clutching a fresh invoice. The answer isn’t in the total spend; it’s hidden in the right metrics.
1. Revenue & Profit – The Bottom Line You Can’t Ignore
First thing’s first: track the rupee amount that actually lands in your bank after the festival rush. For a Thane hardware store, we saw ₹4.2 lakh of sales over a ten‑day Diwali window, but after deducting the ₹1.1 lakh cost of goods sold, the profit was only ₹90,000. Without separating gross revenue from net profit, you’ll keep guessing whether the campaign paid off.
How to capture it
- Link your e‑commerce platform (Shopify, WooCommerce) or POS system to Google Analytics 4 using the
ecommerceevents. - Set up a custom dimension for “Diwali Campaign” so you can filter revenue by that label.
- Pull the final profit figure in a spreadsheet and compare it with the same period last year.
2. Conversion Rate – Quality Over Quantity
Many small businesses celebrate a high click‑through number and call it a win. A Bandra boutique ran a carousel ad that generated 3,200 clicks, yet only 68 purchases followed – a conversion rate of 2.1%. The industry average for fashion e‑commerce hovers around 3‑4%, so the campaign was under‑performing despite the buzz.
What to watch
- Landing‑page load time – every extra second can drop conversions by up to 7%.
- Mobile‑first design – over 65% of Diwali shoppers in Mumbai shop on phones.
- Clear call‑to‑action – “Shop the Diwali Collection” beats a vague “Learn More”.
3. Cost per Acquisition (CPA) – How Much Are You Paying for a Customer?
CPA is the metric that separates a savvy marketer from someone who’s just burning cash. In a recent Diwali push for a Thane hardware store, the average CPA was ₹450, while the average order value (AOV) sat at ₹1,200. That left a healthy margin. Contrast that with a boutique that paid ₹1,200 for each customer when their AOV was only ₹1,100 – a clear loss.
Calculate it right
Take your total ad spend for the campaign (say, ₹60,000) and divide it by the number of first‑time purchases (130). That gives a CPA of ₹462. If your profit per customer is less than this, you need to either tighten targeting or improve the offer.
4. Return on Ad Spend (ROAS) – The Quick‑Check Indicator
ROAS = Revenue ÷ Ad Spend. A simple ratio, but I’ve seen owners treat a ROAS of 3× as “good” without considering profit margins. For the Bandra boutique, a 4× ROAS translated to ₹240,000 revenue on a ₹60,000 spend, but after product costs, the net gain was only ₹30,000.
Set realistic targets
- Identify your break‑even ROAS: (Cost of Goods + Fixed Costs) ÷ Revenue per Sale.
- Aim for a ROAS at least 1.5× your break‑even figure.
- Use Google Ads’ “Target ROAS” bidding if you have enough conversion data.
5. Engagement Metrics – Signals, Not Success
Likes, comments, and video views feel good, but they don’t move the bottom line. A Diwali video ad for a Bandra sweet shop racked up 12,000 likes, yet only 150 orders followed. The mistake many make is treating engagement as the end goal.
What matters more
- Click‑through Rate (CTR) – a higher CTR usually means your creative resonates with the right audience.
- Add‑to‑Cart Rate – tracks intent beyond just a click.
- Cart‑Abandonment – monitor it with a 24‑hour reminder email to rescue lost sales.
6. Repeat Purchase Rate – Building Loyalty After Diwali
Diwali is a one‑off spike; the real profit comes from turning those new customers into repeat buyers. A Thane hardware store saw a 15% repeat purchase rate within 30 days of the campaign, lifting their monthly revenue by ₹35,000 after the festival.
How to boost it
- Send a post‑Diwali thank‑you SMS with a 5% coupon valid for the next month.
- Invite first‑time buyers to join a loyalty program on your website.
- Use automated email flows to showcase complementary products.
7. Common Mistake: Ignoring the “Attribution Window”
Many owners set a 1‑day conversion window and then declare the campaign a flop. Diwali buying cycles are longer – people browse on the 15th, compare prices on the 20th, and finally purchase on the 27th. Extending the attribution window to 7‑10 days captures that delayed conversion and gives you a truer picture.
8. The One‑Step Action You Can Do Today
Open Google Data Studio (now Looker Studio), connect it to your Google Ads and Analytics accounts, and create a simple dashboard with these five cards: Total Revenue, CPA, ROAS, Conversion Rate, and Repeat Purchase Rate. Set the date range to “30 days ending on Diwali”. In the next hour you’ll see exactly where the money is coming from and where it’s leaking.
When the numbers are in front of you, you stop guessing and start tweaking – whether it’s cutting a non‑performing ad set, boosting a high‑ROAS product, or sending a timely follow‑up message. That’s the real power behind tracking the right Diwali metrics.
Related Reading
Share this article
Grow Your Mumbai Business Online
Get a free ₹15,000 digital marketing audit.
No commitment. Results guaranteed.